Aug 26, 2019
FAQ: California's Waterfowl Breeding Population Survey
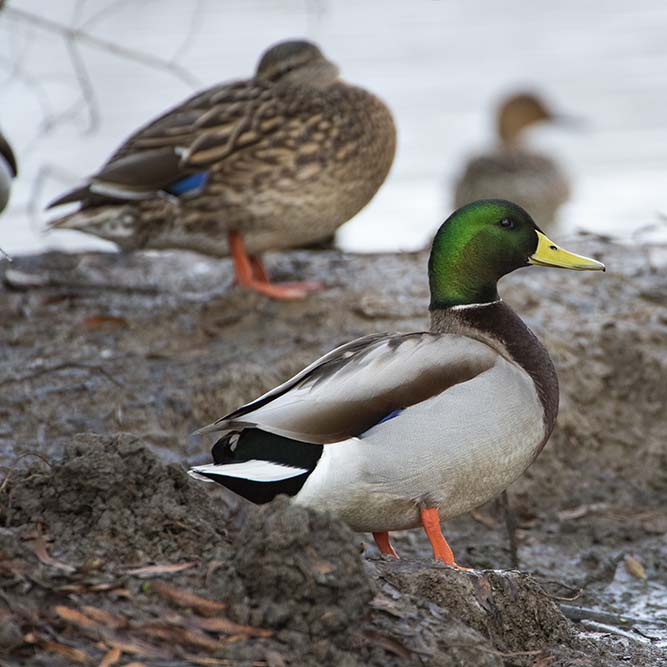
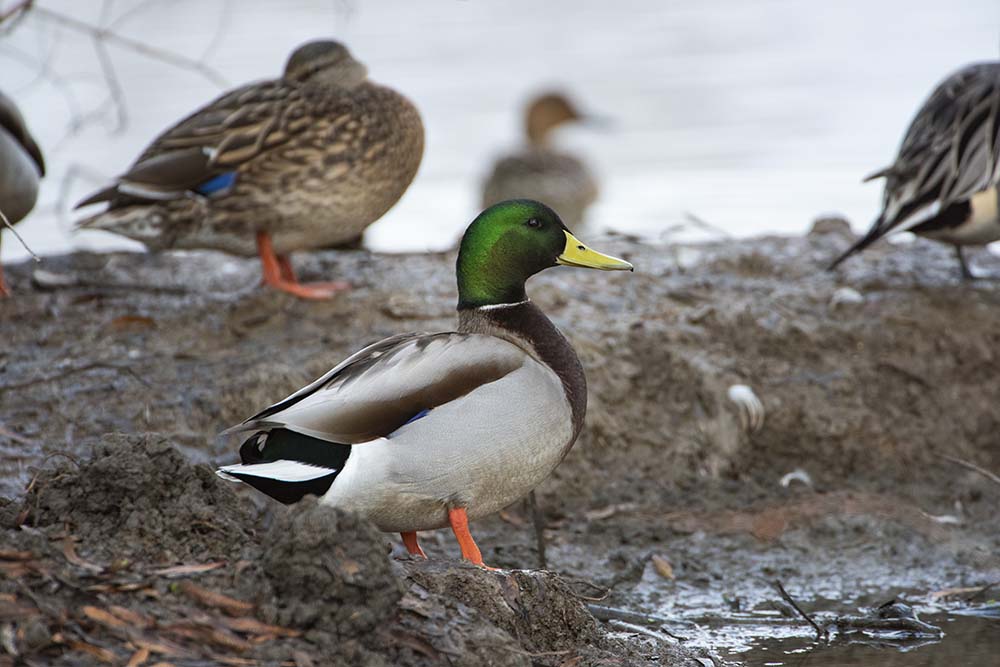 PHOTO BY WAYNE TILCOCK
by CAROLINE BRADY, WATERFOWL PROGRAMS SUPERVISOR
When we posted the state breeding population survey results on Facebook in June (read article here), there were a LOT of questions. In case you missed it, the June 28 report said the mallard breeding population was down 12% at the very same time many of our members were seeing a lot more breeding pairs and broods than last year on the water all around them.
Many thought the survey was bunk. We’re here to tell you it’s not. Use the links below to skip to the questions that interest you most, or read the whole thing to become a more informed waterfowler and dazzle your friends with your newfound knowledge.
QUESTIONS
—What is the survey?
—How were survey areas chosen?
—Why does the state fly the same paths every year? Don’t you miss ducks if you don’t fly the entire state?
—How could the California survey have such low numbers when I’m seeing lots of production where I live?
—Does harvest always go down when breeding populations go down?
—So if production and harvest are better this year than the breeding population count, does that mean we don’t need to worry about the breeding population?
—California survey data always goes back just to 1992, but the continental survey goes back further. Why is that?
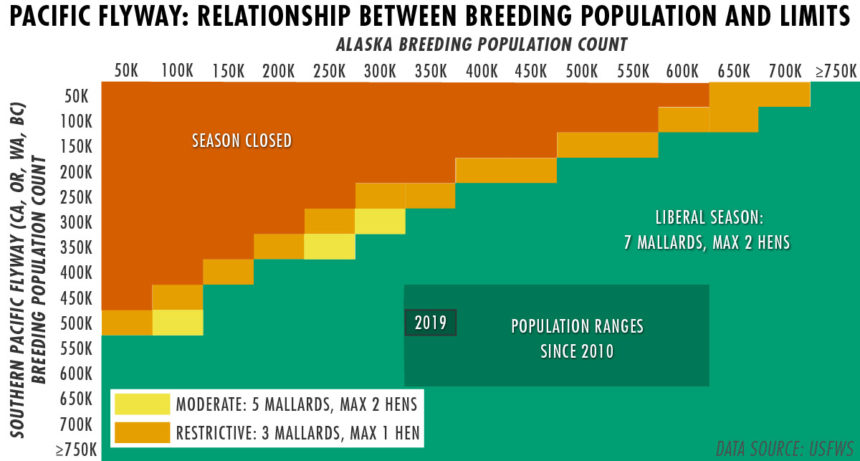
—Why does the Pacific Flyway need its own model for mallard harvest regulations?
—If the mallard population is in decline, would reducing our mallard bag limit from 7 to 5 help?
ANSWERS
What is the survey?
The California Department of Fish and Wildlife Waterfowl Breeding Population Survey is an annual count of breeding pairs in selected areas of the state. It is conducted by air, and it is designed to be comparable in methodology to the Waterfowl Breeding Population and Habitat Survey conducted each spring by the U.S. Fish & Wildlife Service's Migratory Bird Program, state wildlife agencies and the Canadian Wildlife Service. That survey is designed to estimate the size of breeding waterfowl populations across North America in principal breeding areas and to evaluate habitat conditions on the breeding grounds.
How were surveys areas chosen?
![]() The California Survey consists of nine strata. A stratum is a defined geographic unit encompassing areas of similar waterfowl densities and is generally of a single or unique complex of habitat type(s). Within a single strata there are multiple transects (the dotted lines in the map shown here); these are the sampling units of the California survey.
The California Survey consists of nine strata. A stratum is a defined geographic unit encompassing areas of similar waterfowl densities and is generally of a single or unique complex of habitat type(s). Within a single strata there are multiple transects (the dotted lines in the map shown here); these are the sampling units of the California survey.
When the survey was designed, a randomly selected starting point for generating transects within the Central Valley was established just south of Red Bluff. Transects that run through most of the Central Valley are placed parallel at 14-mile intervals to reflect the pair density and habitat that is available in that region. Due to low waterfowl densities, transects are spaced 28 miles apart in the San Joaquin Desert stratum. Central Valley transects are oriented at 45° to minimize biases associated with transects that might run parallel or perpendicular to waterways.
In most strata, transects are a continuous series of segments, but for Suisun Marsh, Napa-Santa Rosa and Northeastern strata, segments are disjunct because they are designed to fit within the geographic features of the valleys (i.e., Napa-Santa Rosa and Northeastern), or to provide a representative sample of areas surveyed before the current survey was designed (i.e., Suisun Marsh and Northeastern).
Why does the state fly the same paths every year? Don’t you miss ducks if you don’t fly the entire state?
In order to be statistically sound (i.e. repeatable and comparable to previous survey years and the continental survey), you have to be able to replicate your methods. In order to get a true grasp on what’s happening on a large scale, you need to make observations of breeding pairs along the same routes every year. Moving transects or using a “search and sample” technique would make the survey invalid, because it would no longer be analogous to the decades of previously collected data.
The objective of a survey like California’s is to track changes in key areas over a long period of time. Exploratory flights executed during the design phase of the current California survey located areas with significant numbers of breeding ducks present. Transects were placed in a variety of habitat types where birds were known to be breeding at various densities. They represent a slice of the bigger picture, which generates the estimate of birds on a broader regional scale.
It is important to know “ducks are here,” but it’s just as important to know “hey, those ducks that used be here aren’t this year.” When birds are repeatedly “not here,” that should signal to you that something has changed because these are the types of fluctuations that annual surveys detect. If you were to move transects every year, you wouldn’t be able to detect population changes.
How could the California survey have such low numbers this year when I’m seeing lots of production where I live?
Those are great observations. What you’re seeing locally may be reflected by what biologists are seeing from the plane if you live in the Delta or western part of the Central Valley; those were the only two regions to increase in breeding pairs of mallards.
Additionally, what observers see while flying these surveys, which take place in late April and early May, does not always equate to high or low production later on in the summer when nests are hatching.
Also, there are many things that are game changers after peak nest initiation has taken place, one of those being weather. The late May rains we received kept the landscape wet longer than usual, offering potential for multiple rounds of nesting this summer.
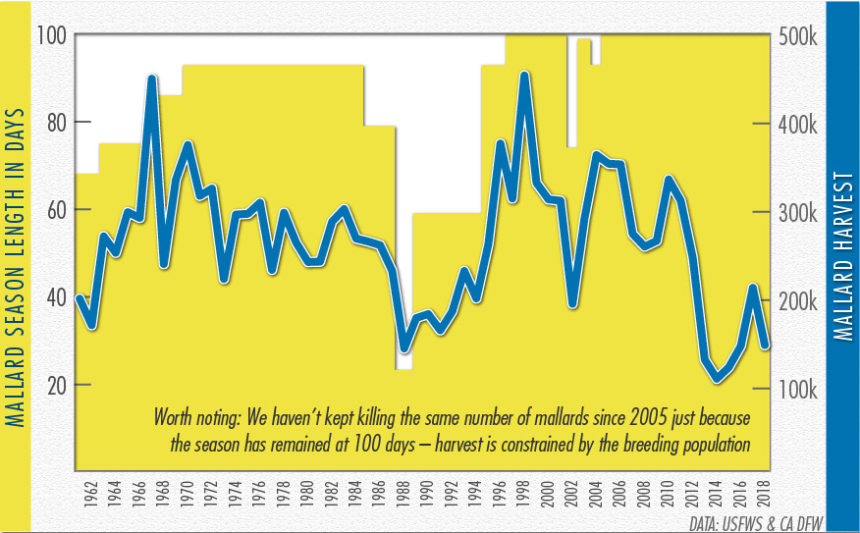
Does harvest always go down when breeding populations go down?
Generally, the mallard harvest in California tracks with the state’s mallard breeding population, because 60-70% of mallards harvested here hatched here.
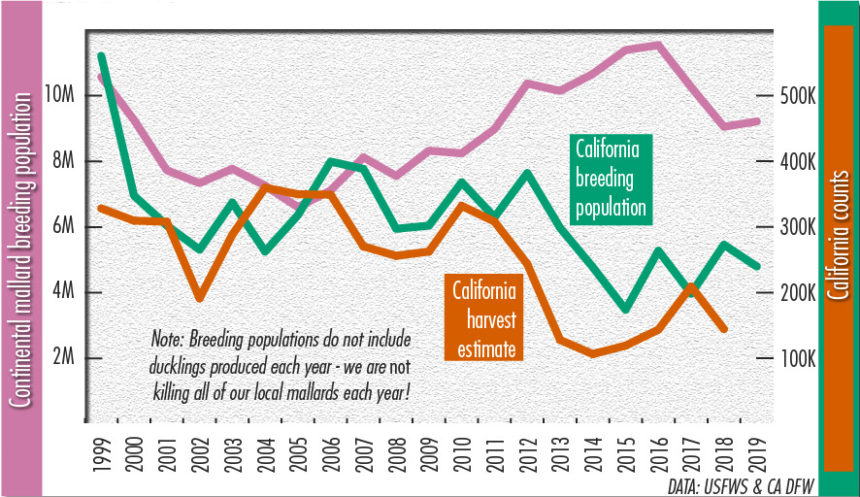
But the breeding population count is only one factor that affects how many mallards will be in our skies this winter. It’s just a count of breeding pairs – not of the ducklings they produced. We don’t have a brood survey, but there is a standard production measure: the ratio of young-of-the-year ducks to adult ducks on our straps – the more juveniles, the better production was that year. Unfortunately, while you may have seen a lot of ducklings in your region this summer, we don’t get the actual statewide measurement until long after duck season ends.
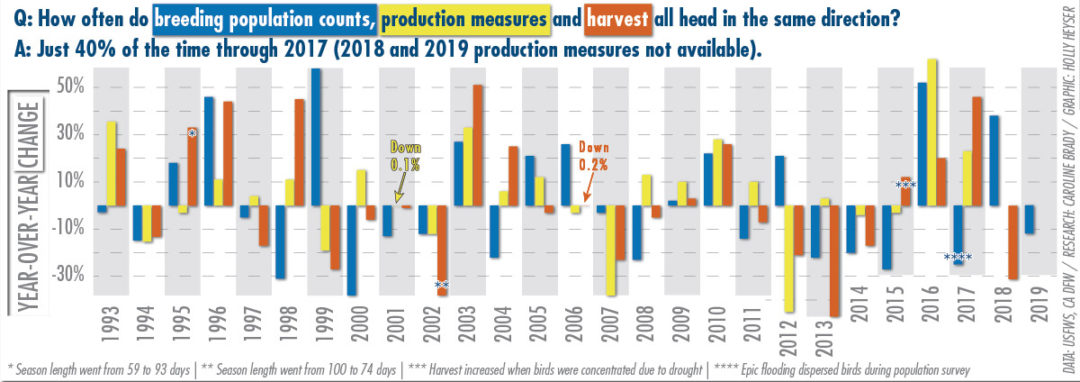
So if production and harvest are better this year than the breeding population count, does that mean we don’t need to worry about the breeding population?
 Only if you don’t like hunting mallards. The trends are clear: We are losing breeding habitat (see article in the Fall issue of California Waterfowl), and we don’t get a ton of mallards from the Prairie Pothole Region like the rest of the country does, so if we don’t make more mallards here, our mallard harvest will suffer long-term.
California survey data always goes back just to 1992, but the continental survey goes back further. Why is that?
The California Department of Fish and Wildlife Waterfowl Breeding Population Survey underwent a re-design in 1990-91 to replicate the methods and objectives that the U.S. Fish and Wildlife Service Waterfowl Breeding Population and Habitat Conditions Survey (the continental survey) follows to estimate breeding mallards on the continental scale.
This standardized and statistically validated the California Survey data, so that it could be incorporated and used to create a Pacific Flyway-level mallard adaptive harvest management model called the Western Mallard Model, which is used to set mallard limits in the Pacific Flyway. The first statistically sound/defensible survey was flown using these new methods in 1992. When both state and federal surveys have the same design and methods, confidence in survey results is higher because both face the same rigor of statistical analysis.
The biggest issues with the California breeding pair surveys of years past was that they were not repeatable, they covered only a small sample of the state (2,650 miles vs. the current 21,247 miles), they did not have a “vision correction factor” (ground-truthing what observers are seeing from the plane by getting a complete count of birds from a helicopter on a subsample of transects), and they were not timed to the nesting cycle of California mallards, which start their nests about one month earlier than prairie mallards.
Why does the Pacific Flyway need its own adaptive harvest management model?
The mid-continent adaptative harvest management model first came on the scene in 1995. It is an iterative cycle of monitoring (population and harvest surveys), assessment (data analysis), and decision making (what the model spits out: bag limits and season length) to clarify the relationships among hunting regulations, harvests and waterfowl abundance. The model learns from experience each year based on previous iterations and input of new survey data.
Up until 2008, the waterfowl regulations we hunted under here were derived from the mid-continent analysis, so we were at the mercy of the boom/bust cycle of the U.S. and Canadian prairies’ duck breeding population, even though the majority of mallards we harvest hatched in California. We had to go to great lengths to prove that Pacific Flyway mallards were unique from the mid-continent breeding stock.
The addition of Western Model in 2008 made it possible to base our harvest regulations on mallard breeding populations in California, Oregon, Washington, British Columbia and Alaska.
Source: Pages 14, 17 and 23 of this report (PDF)
If the mallard population is in decline, would reducing our mallard bag limit from 7 to 5 help?
This is a very popular idea amongst concerned hunters, but I’m going to burst your bubble here:
1) The decline of California breeding mallards is a consequence of a habitat deficiency, not harvest.
2) Reducing the limit to five would not reduce harvest in California. Regardless of how many mallards you and your buddies shoot, a recent national harvest survey shows an average mallard harvest of 2.8 mallards per season for California duck hunters.
In order to decrease harvest, we would need to reduce the length of the mallard season to about 60 days to see any gains, or reduce the mallard limit to three per day.
I’m fairly sure the vast majority of California waterfowlers would not be willing to do that, especially since habitat has been identified as the key factor in the mallard decline.